이미지 분석 (Digital surf)
A화상 환자의 상처 치료 개선을 위한 SEM 분석

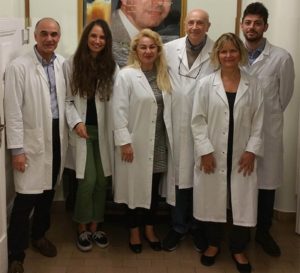
상처의 세균 감염은 심각한 화상 부상 후 피부 이식을 받는 환자의 주요 위험입니다. 캐나다 몬트리올에 있는 몬트리올 대학 병원 센터(CHUM)의 성형 및 재건 외과의 모니카 일리에스쿠 넬레아(Monica Iliescu Nelea) 박사(왼쪽)와 미셸 알랭 다니노(Michel Alain Danino) 박사는 이 현상에 대한 의학적 이해를 증진하기 위해 노력하는 연구자 그룹의 일원입니다.
생물막은 군체를 형성하기 위해 응집된 박테리아 미생물의 층입니다. 생물막은 상처 드레싱을 포함한 많은 표면에서 발생할 수 있습니다. 이것은 종종 면역 체계가 약하거나 손상되기 때문에 화상 상처로 피부 이식을 받는 환자에게 특히 중요할 수 있습니다.
기증자 부위로 알려진 건강한 피부를 채취하는 부위는 특히 생물막 형성에 취약하며, 그 존재는 정상적인 상처 치유를 강력하게 손상시킵니다. 이것은 차례로 환자에게 고통의 원인이 될 수 있으며 궁극적으로 흉터 미학에 영향을 미칩니다.
SEM: 생체 재료 표면 특성 분석을 위한 최첨단 도구
연구진은 Thermo Scientific™(구 FEI) Quanta™ 450 FEG 환경 주사 전자 현미경(ESEM)™ 을 사용하여 화상 환자의 피부 이식 기증자 부위에서 박테리아 생물막 형성을 방지하는 데 사용되는 두 가지 유형의 상처 드레싱의 효능을 비교했습니다. 한 드레싱에는 3% 농도의 비스무트 트리브로모페네이트가 함유되어 있어 정균(항균) 특성(Xeroform™)을 부여합니다. 다른 하나는 흡수성 알긴산 칼슘 나트륨 드레싱 (Kaltostat™)이었습니다.
실제 화상 환자 기증자 부위에서 직접 추출한 드레싱 샘플을 박테리아 생물막 밀도에 대해 분석한 다음 비교했습니다. 샘플은 생물막 미세 구조의 무결성을 유지하는 것을 목표로 연구팀이 개발 한 독창적 인 방법을 사용하여 주사 전자 현미경 (SEM) 분석을 위해 준비되었습니다. 오늘날까지 SEM 이미징은 드레싱 분석에 거의 사용되지 않았으며 이 특정 응용 분야에서 현장 생물막 시각화에 사용된 것은 이번이 처음입니다.
결과 분석
상처 드레싱 샘플에서 얻은 SEM 이미지에서 연구팀은 박테리아의 우세와 박테리아 생물막의 존재에 따라 점수를 할당했습니다.
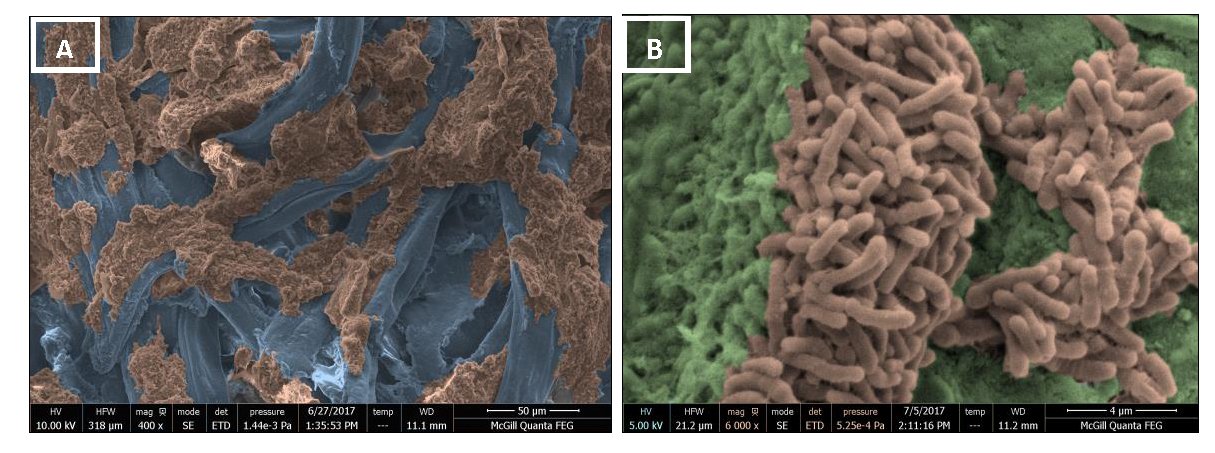
위. 다양한 배율에서 Kaltostat™ 상처 드레싱의 착색된 SEM 이미지. 채색은 산®을 기반으로 하는 TopoMaps 소프트웨어로 수행되었습니다. 박테리아 생물막은 밝은 갈색으로 착색되어 볼 수 있습니다.
SEM 이미지에서 다양한 유형의 박테리아를 분리된 형태와 생물막 내 클러스터 모두에서 쉽게 식별할 수 있었습니다. 예를 들어, 구균 형 박테리아가 생물막을 형성하는 것을 관찰 할 수있었습니다. 간균 형 생물막과 연쇄상 구균도 관찰되었습니다. 이러한 모든 유형의 박테리아는 두 드레싱 모두에서 검출되었으며, 주요 차이점은 Kaltostat™ 드레싱에서 눈에 잘 띄었고 Xeroform™ 드레싱에서 양과 빈도 모두에서 덜 두드러졌다는 것입니다.
위의 이미지는 Mountains® 기반 TopoMaps 소프트웨어를 사용하여 채색되었습니다1, 박테리아 생물막이 갈색으로 착색되고 상처 드레싱 섬유가 파란색으로 착색되는 저배율 보기(A)에서 박테리아 생물막의 존재와 정도를 증명합니다.
또한, 더 높은 배율 보기 이미지(B)는 박테리아 클러스터(갈색)와 박테리아를 부분적으로 둘러싸고 생물막을 형성하는 세포외 다당류 네트워크(EPS 매트릭스, 녹색)를 보여줍니다. Iliescu 박사는 "이미지를 채색함으로써 저배율에서 SEM 이미지에서 박테리아 생물막의 존재를 더 잘 강조하는 데 도움이 되었다"며 "또한 박테리아 응집체(클러스터)의 존재와 고배율에서 SEM 이미지에서 EPS 매트릭스의 형성을 향상시키는 데 도움이 되었다"고 말했습니다.
A2D 재료의 초분광 맵 탐색

특정 밴드갭으로 2D 반도체 헤테로 구조를 조정하는 것은 현재 나노기술 분야에서 일하는 연구자들에게 뜨거운 주제 중 하나인 전자 및 광전자공학을 위한 새로운 양자 재료를 활용하는 핵심 측면입니다. 몬태나 인스트루먼트(Montana Instruments)의 응용 과학자인 크레이그 월(Craig Wall)은 최근 라만 분광법과 광발광 결과를 분석하기 위해 마운틴® 소프트웨어를 사용하여 이 주제를 조사했습니다.

가변 온도 환경에서의 2D 이종 구조 어셈블리
기본적인 헤테로 구조 조립 원리는 간단합니다 : 각질 제거, 예를 들어, MoS의 단층2 (이황화 몰리브덴), WS와 같은 다른 단층 또는 소수층 결정 위에 올려 놓으십시오2 (텅스텐 분해), 다른 2D 크리스탈 추가 등. 결과적인 헤테로 구조는 반 데르 발스 (van der Waals) 힘에 의해 함께 유지되는 단층 정밀도로 지정된 순서로 조립 된 인공 재료를 나타냅니다.
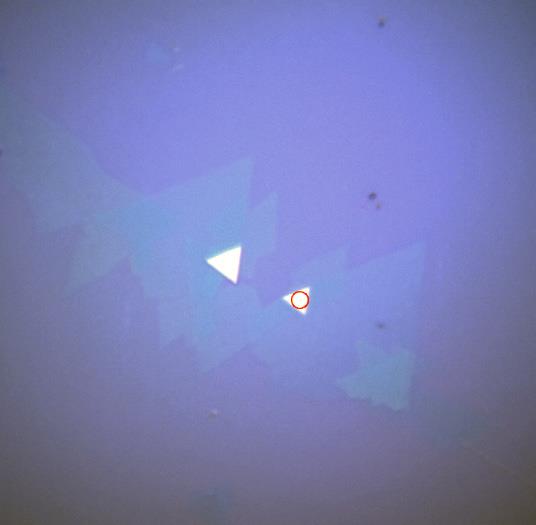
그림 1. MoS의 백색광 이미지2증권 시세 표시기2 다층 헤테로 구조
종종 샘플에 대한 추가 또는 새로운 정보는 온도에 따른 측정을 통해 드러날 수 있습니다. 이 연구에서는 전체 온도 범위(2K에서 4K)에 걸쳐 높은 공간 분해능과 수집 효율성을 유지하는 microReveal 라만 분광법 및 광발광 플랫폼을 사용하여 500D 재료의 효율적인 초분광 매핑을 입증할 수 있었습니다. 이 시스템은 낮은 열 질량 시료 스테이지, 진공 내 높은 NA 대물렌즈, 낮은 난시, 광대역 분광기에 광학 장치를 통합하여 가변 온도 시료 드리프트와 관련된 문제를 극복합니다.
적층된 MoS의 엑시톤 재조합 역학2-WS2 헤테로 구조는 이전에 실내 온도에서 연구되었습니다재.1-2 가전자대의 최대값과 전도대의 최소값은 WS의 층에서 분리됩니다2 및 MoS2각각. MoS에 대해 보고된 에너지 격차2 는 2.39입니다eV 및 WS용2 는 2.31입니다eV. MoS의 최대 원자가 밴드 간의 에너지 차이2 및 WS2 약 350meV입니다. 광여기 자유 전자-정공 쌍은 층 계면에서 분리된 상태를 유지하는 것을 선호합니다. WS의 여기 된 전자2 MoS의 전도대에 축적되는 경향이 있습니다.2 MoS의 원자가 밴드에 구멍이 생성되는 동안2 WS로 이전하는 경향이 있습니다.2 인터페이스에서. 공간적으로 분리된 캐리어의 층간 복사 재조합은 광발광 스펙트럼에서 추가 피크를 유도할 수 있습니다. 우리의 조사에서, 우리는 순수한 단층 MoS에 비해 낮은 에너지에있는 초 분광 매핑 연구에서 층간 엑시톤을 관찰 할 수있었습니다2 및 WS2.
결론
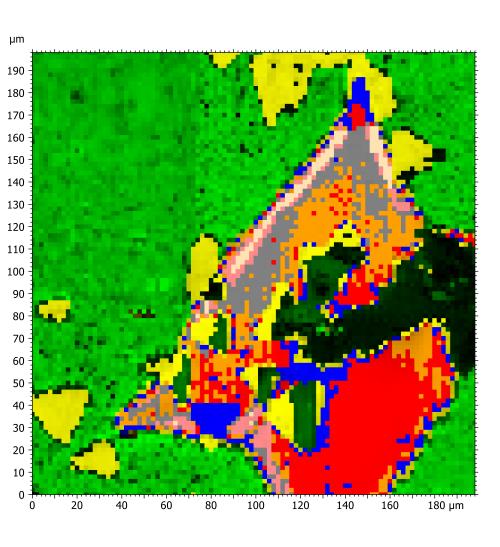
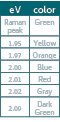
열역학적 드리프트와 안정성은 실험 전반에 걸쳐 온도를 체계적으로 변화시킬 때 제어하기가 더 복잡해집니다. 초분광 맵(아래 참조)은 200μm 픽셀의 200μm x 1μm이며 각 맵을 구성하는 40,000개의 스펙트럼 수집에는 microReveal로 달성할 수 있는 초저 열역학적 드리프트가 필요합니다. MoS의 에피택셜 및 비에피택셜 헤테로구조 연구2-WS2 실리콘에서 층간 엑시톤 이완이 적층 에피택시 및 방향과 무관하다는 것을 시사합니다(그림 참조). 13. 비-에피택셜 헤테로구조의 경우, 온도를 5K에서 150K로 올리면 베이스 WS로부터의 PL의 강도에 대한 에지 효과가 나타났다2 층.
초분광 광발광 지도
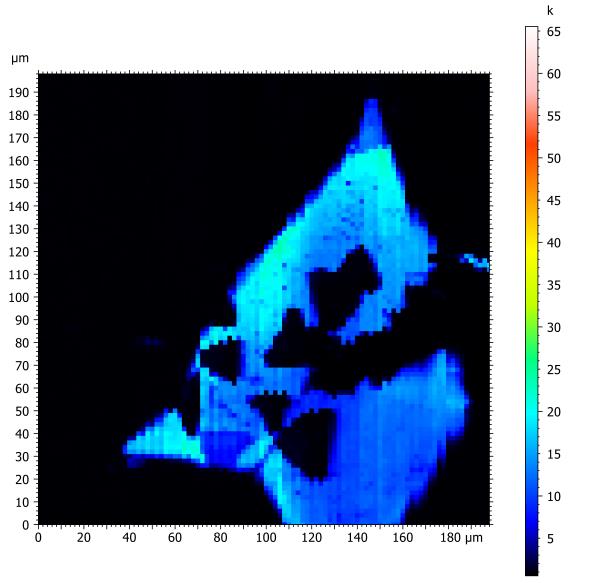
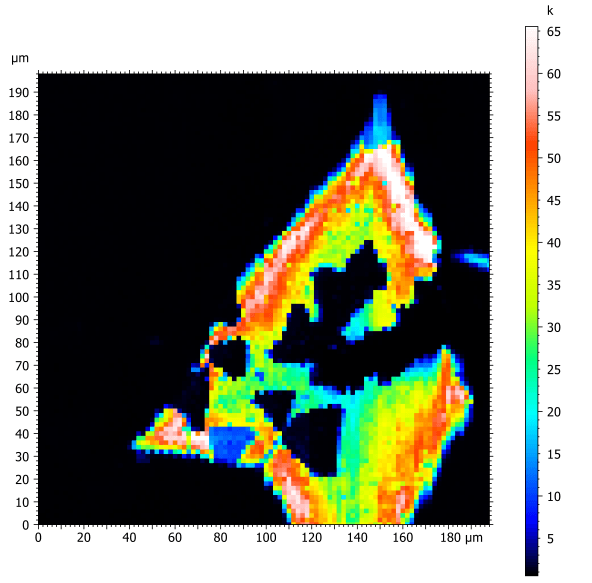
위. 비에피택셜 MoS2-WS2 5K에서. 위. 비에피택셜 MoS2-WS2 150K에서.
k를 사용한 주성분 분석은
고유한 스펙트럼 기여도를 보여주는 클러스터링을 의미합니다.
위. 비에피택셜 MoS2-WS2 5K 에서. 비에피택셜 MoS2-WS2 150K에서.
초분광 지도와 고급 주성분 분석(PCA)은 Mountains® 소프트웨어로 수행되었습니다.
A기계 부품의 마찰 인터페이스 평가

스웨덴 룰레오 공과대학교(Luleå University of Technology)와 스카니아(Scania)의 연구원들은 최근 표면 지형이 기어와 관련된 마찰 계면에서 유막 형성에 어떤 영향을 미치는지 조사했습니다. 이 연구는 연비와 지속 가능성의 개선을 지향했습니다. 연구팀의 일원인 Jonny Hansen(아래 사진)은 Mountains® 소프트웨어가 결과를 달성하는 데 어떻게 사용되었는지 설명합니다.

설계 단계에서는 매끄러운 표면보다 거친 표면을 개발하는 것이 경제적으로 더 유리한 경우가 많습니다. 그러나 실제로는 표면이 거칠수록 표면 조난과 비용이 증가할 수 있습니다. 따라서 기어 제조업체의 과제는 상대적으로 거친 표면에 대해 적절한 윤활 품질을 유지하는 것입니다. 이 연구에서는 MountainsMap® 소프트웨어를 사용하여 가장 눈에 띄는 봉우리가 제거되는 한 표면을 거칠게 유지할 수 있음을 증명했습니다. 결과는 마찰과 마모를 최소화하기 위해 마찰 계면의 구조를 제어하는 것의 중요성을 강조합니다.
마찰 테스트 시퀀스
마찰 테스트를 위해 거친 표면(0.3μm)과 반대 매끄러운 표면의 볼 온 디스크 설정을 사용한 마찰 테스트가 사용되었습니다. 테스트 조건은 기어에서 볼 수 있는 것과 유사하도록 설정되었습니다(예: GPa 압력과 롤링으로 인한 높은 수준의 슬라이딩에 노출된 윤활 강철 표면). 작동 조건은 시험 내내 일정하게 유지되었고, 볼과 디스크의 접촉점 사이에 0.05μm의 공칭 유막 두께를 생성하도록 구체적으로 선택되었다.
따라서 테스트는 상당한 접촉 간섭 하에서 시작되었습니다. 테스트가 계속됨에 따라 마모로 인해 표면이 변경되었고 윤활 품질이 연속적으로 개선되었습니다. 테스트가 끝나면 유막이 완전히 형성되었고 금속 접촉이 지속되지 않았습니다.
MountainsMap®의 표면 재배치 분석
3D 표면 거칠기 데이터는 광학 프로파일로미터를 사용하여 볼의 거친 표면에서 획득되었습니다. 일반적으로 테스트 전후에 동일한 영역을 평가할 때 표면 정렬 불량 문제가 발견될 수 있습니다. 따라서 다음과 같은 후처리 루틴이 MountainsMap®에 적용되었습니다.
- 두 개의 스터디어블이 로드되고 "양식 제거" 기능이 사용되었습니다.
- 거칠기 프로파일을 기본 프로파일과 분리하기 위해 견고한 가우스 필터가 사용되었습니다.
- "Shift surface" 연산자는 측면 및 회전 정렬 불량을 수정하기 위해 일련의 스터디어블에 사용되었습니다(아래 세부 정보 참조).
- "추출 영역" 작업자는 마모된 영역만 평가하는 데 사용되었습니다.
주요 결과
그림 1(아래)은 MountainsMap®에서 수행된 표면 재배치 해석 결과를 보여줍니다. 가장 두드러진 봉우리는 제거되었지만 표면 지형의 구조는 여전히 남아 있음을 알 수 있습니다. 이 두 가지 변경 사항은 윤활 품질 향상에 기여하며, 궁극적으로 테스트가 끝날 때 완전한 필름 분리가 가능합니다.
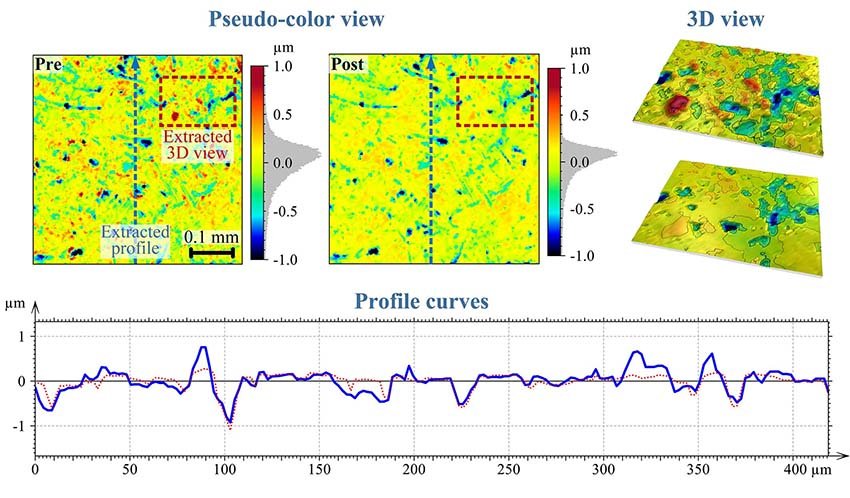
그림 1. 실행 테스트 전후에 검사한 표면. 가장 두드러진 피크는 마모 및 소성 변형으로 인해 제거되었습니다.
이러한 결과를 통해 표면 거칠기의 통계 데이터를 계산할 수 있었습니다. 기술 도면에 나타나는 가장 일반적인 매개변수의 예는 아래 그림 2에 나와 있습니다.
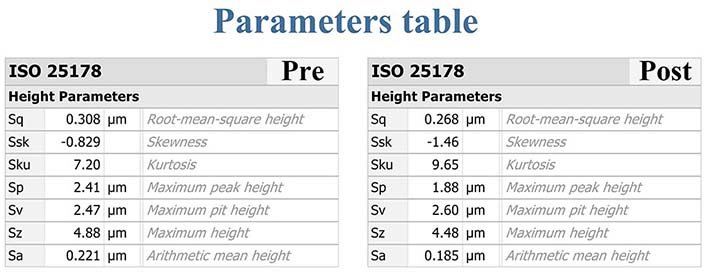
그림 2. 일반적인 3D 거칠기 매개변수입니다. 피크 파라미터는 상당한 감소를 보이는 반면 밸리 파라미터는 약간의 증가를 보이며, 둘 다 윤활 품질 향상에 기여합니다.
결과는 표면 거칠기 피크가 특히 유막 파괴에 취약하여 마모 및 소성 변형에 취약하다는 것을 나타냅니다. 계산된 유막 두께(0.05μm)를 테스트 후 얻은 Sq 매개변수와 비교할 때(표준 관행에 따라) 유막이 표면 RMS 높이보다 5배 이상 얇을 수 있음이 분명해졌습니다. 이 진술은 모순되는 것처럼 보일 수 있지만 거친 표면이 접촉 영역 내에서 탄성적으로 변형된다는 사실에서 비롯됩니다. 이것은 출판 된 기사에서 더 자세히 논의됩니다 (자세히 읽기).
결론
MountainsMap® 소프트웨어를 사용하여 완전히 분리 가능한 유막이 형성되기 위해 표면 거칠기가 어떻게 변해야 하는지 연구할 수 있었습니다. 가장 두드러진 봉우리는 제거되고 표면의 주요 구조는 남아있는 것으로 나타났습니다. 이러한 발견은 엔지니어가 회전 기계를 위한 내구성 있고 에너지 효율적인 마찰 인터페이스를 설계하는 데 도움이 될 수 있습니다.
A귀 뼈 침식: SEM 이미지 3D 재구성은 원인이 되는 세포를 식별하는 데 도움이 됩니다.

경찰 수사나 범죄 소설에서는 범인을 발굴하기 위해서는 먼저 지문을 찾아 분석해야 하는 경우가 많다. 이탈리아 로마 사피엔자 대학교(Sapienza University of Rome)의 연구팀은 중이에 상피 덩어리가 형성되어 염증, 통증 및 청력 상실을 유발하는 상태인 귀 병리 진주종(CHO)의 수수께끼를 해결하기 위해 이와 동일한 접근 방식을 사용했습니다. 이 병리의 수수께끼 : 어떤 세포가 중이 인커스 뼈를 침식하는 데 책임이 있습니까?
Incus 뼈 침식은 진행성 CHO의 전형적인 특징으로 간주됩니다. 그러나 흡수 lacunae 여부는 여전히 논쟁의 여지가 있습니다1 Incus 뼈의 표면은 파골 세포에 의해 발생합니다2 행동. 이 문제를 해결하기 위해 연구 그룹은 골다공증성 인간 대퇴골(의심할 여지 없이 파골세포 기원)의 목에 있는 흡수 베이와 CHO의 영향을 받는 인육골에 존재하는 흡수 베이를 관찰했습니다.
정량 분석을 위한 4-사분면 재구성
연구를 주도한 Michela Relucenti 교수는 "우리는 단 한 번의 스캔으로 3500개의 이미지를 동시에 얻을 수 있는 3사분면 BSE 검출기가 장착된 주사 전자 현미경 Hitachi VP-SEM SU 3의 BSE 이미지를 사용했습니다. "얻은 <>개의 사진은 산®을 기반으로 하는 Hitachi 지도 <>D 소프트웨어를 사용하여 <>D 이미지로 재구성하고 정량적 정보를 추출하기 위해 처리되었습니다."
"이러한 유형의 데이터를 얻는 것은 뼈 표면의 형성과 재흡수를 특성화하는 데 일반적으로 사용되는 형태학적 분류 매개변수를 구현하는 데 매우 유용했습니다. 사실, 면적, 평균 깊이 및 부피와 같은 흡수 열공의 정량적 데이터를 수집하여 서로 다른 출처(대퇴골 및 incus)에서 파생된 열공을 비교하고 마지막으로 동일한 기원을 가지고 있는지 평가할 수 있었습니다.
흡수 열공 면적, 평균 깊이 및 부피는 Hitachi map 3D로 계산하였다. 자세한 내용을 위해 3D 이미지 재구성에서 단일 틈새를 선택하고 영역, 평균 깊이 및 부피를 자동으로 측정했습니다."
Above. Four SEM images of a CHO incus bone resorption bay formed by several lacunae.
Analyzing results & identifying the culprit
“The data, collected and statistically analyzed, showed that no significant differences exist between the two groups. Therefore, if the fingerprints are the same, then the culprit is the same: in this case the osteoclast!
This quantitative approach implementing morphological characterization allowed us to state that surface erosion of the incus was due to osteoclast action.”
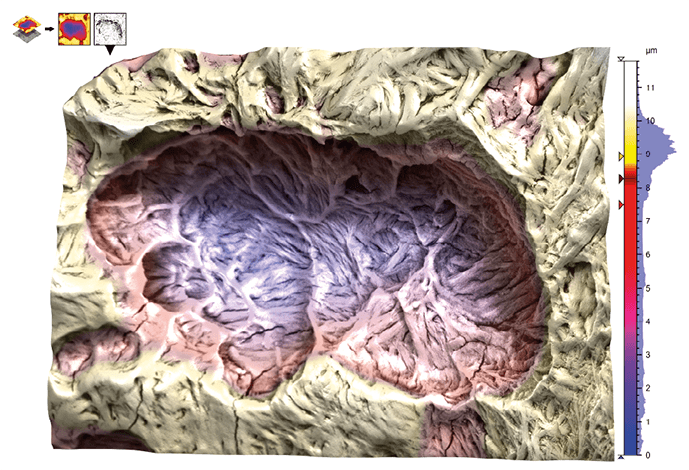
위. Hitachi 지도 3D 소프트웨어를 사용하여 인커스 뼈 침식 표면의 3개의 SEM 이미지에서 생성된 색상으로 구분된 <>D 재구성 모델. 흡수 베이에는 여러 개의 lacunae가 있습니다.
악안면 병리에 대한 새로운 이해와 치료
이 연구에 사용된 새로운 스캐닝 특성화 접근 방식은 처음으로 인커스 뼈 침식의 3D 이미징과 정량적 측정을 허용하여 생물학적 샘플에 대한 정량적 SEM 형태의 새로운 시대를 열었습니다. CHO에서 뼈 침식 발달을 억제하기 위한 새로운 치료 옵션도 밝혀졌습니다.
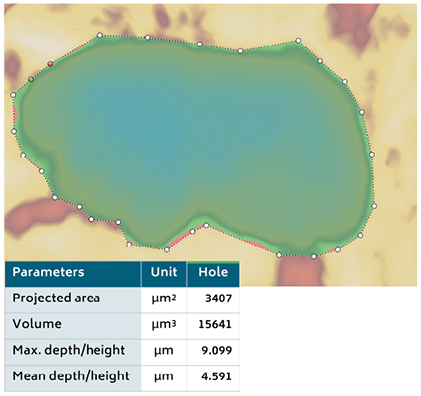
위. Hitachi map 3D 소프트웨어가 형태학적 매개변수 값을 계산한 구분된 단일 틈새입니다.
¹ 재흡수 중인 뼈에서 발견되는 오목한 부분.
² 뼈 조직을 분해하는 뼈 세포의 일종.
A의약품 정제의 품질 관리를 위한 3D 프로파일링

제약 정제는 의약품의 고체 투여 형태입니다. 그들은 다양한 활성 물질로 만들어지며, 그런 다음 압축되어 고체 형태로 성형됩니다. 그들은 쉬운 투여, 낮은 제조 비용 및 높은 물리적 및 화학적 안정성으로 인해 시장에서 가장 많이 사용되는 경구 약물 형태 중 하나입니다.
이러한 유형의 약물은 일반적으로 다양한 용도로 사용되는 코팅으로 둘러싸여 있습니다. 그것은 정제의 맛과 냄새를 가릴 수 있고, 정제의 화학적 및 물리적 구성을 보호하며, 가장 중요한 것은 물질들이 시스템으로의 방출을 제어 할 수 있다는 것입니다.
이러한 코팅은 정제의 취급을 견뎌내고 상이한 성분의 수명을 연장할 수 있을 만큼 충분히 강하고 안정적이어야 한다.
거칠기 측정을 위한 형상 분석
프로파일 로미터 제조업체 인 NANOVEA는 프로파일 로미터를 사용하여 표면 거칠기를 연구하기 위해 코팅 및 코팅되지 않은 다양한 제약 정제에 대한 연구를 수행했습니다.
프로파일러는 표면 특성을 정량화하고 표면 마감을 측정하기 위해 샘플의 지형을 스캔하는 측정 장비입니다. 매우 작은 표면 변화를 감지할 수 있어 품질 관리 테스트에 이상적입니다.
지형 분석
이 연구를 위해 연구원들은 NANOVEA HS2000 Profiler를 사용하여 세 가지 다른 정제 표면의 평균 표면 거칠기를 측정했습니다. 그런 다음 얻은 데이터는 Mountains® 소프트웨어를 기반으로 하는 NANOVEA의 Professional 3D 소프트웨어로 분석되었습니다.
각 태블릿의 표면 지형에 대한 2D 및 3D 높이 맵이 생성되어 구덩이 또는 봉우리와 같은 표면 특징을 시각적으로 빠르게 식별할 수 있습니다.
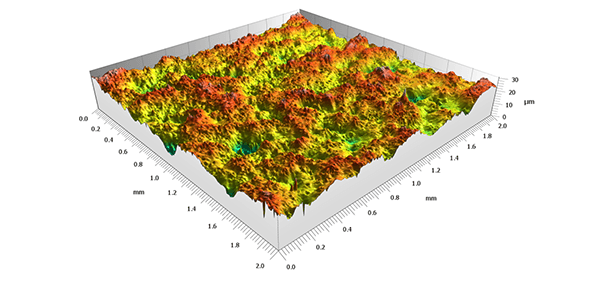
위: 타이레놀 샘플 중 하나의 표면에 대한 3D 보기.
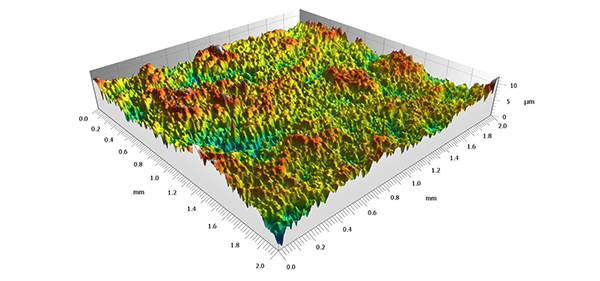
위 : Advil 샘플 중 하나의 표면에 대한 3D보기.
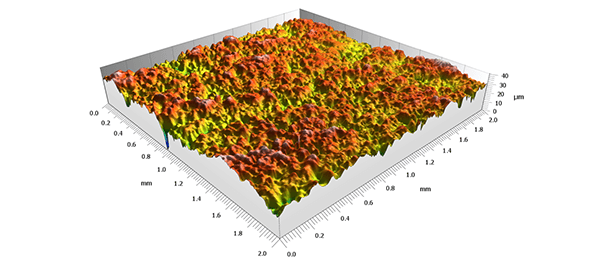
위: Excedrin 샘플 중 하나의 표면에 대한 3D 보기
또한, 각 배치에서 산술 높이, 제곱 평균 제곱근 높이 및 5개의 정제의 최대 높이를 산으로® 계산했습니다.
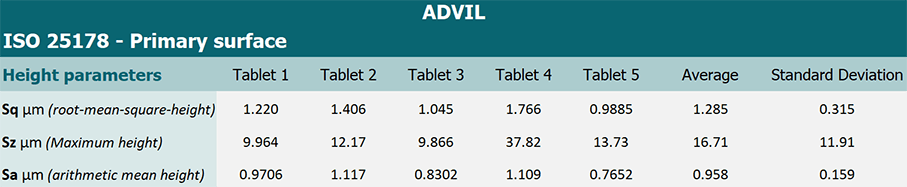
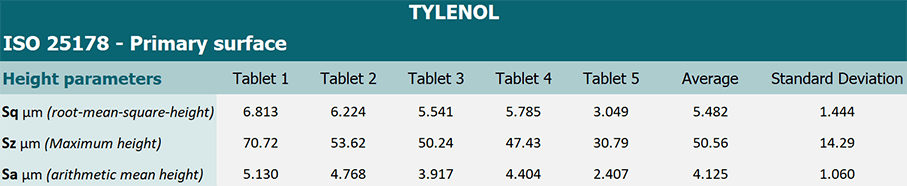
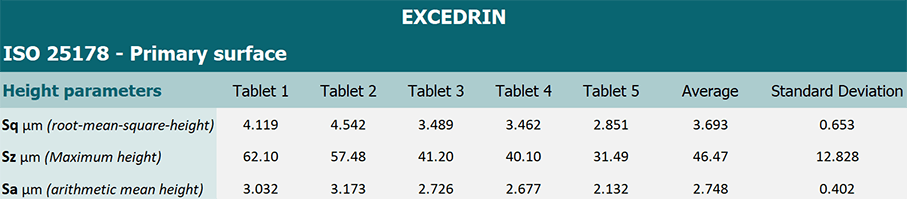
계산된 값은 보호 코팅이 된 정제가 표면 거칠기가 더 낮다는 연구자들의 가정을 확인시켜주었습니다. 이러한 유형의 분석은 낮은 스캔 시간 및 소프트웨어 자동화 기능으로 인한 대량 배치 분석을 포함하여 의약품의 품질 관리 테스트에서 제조업체에 매우 유용할 수 있습니다.
참조
이 사례 연구는 원래 NANOVEA에서 출판했으며 Jocelyn Esparza가 작성했습니다.
더 읽기
사용 된 산® 도구
- 의사 색상 2D 및 3D 보기: 2D 및 3D 뷰 스터디는 표면 지형의 고품질 시각화에 사용되었습니다.
- 매개 변수 테이블은 다음과 같습니다. 매개변수 테이블 스터디는 해석된 표면의 ISO 25178 높이 매개변수를 시각화하기 위해 구현되었습니다.
사용된 기기 및 소프트웨어
고속 라인 센서가 탑재된 NANOVEA HS2000 + 산®을 기반으로 한 전문 3D 소프트웨어.
ACorrelating AFM, SEM & EDX data for nanoparticle analysis

Nanoparticles are used in many common commercial products like cosmetics, foods, pharmaceuticals and require very specific capabilities for their characterization at the nanometer scale. For this application, a research team at the LNE Nanotech Institute (France) combined measurements from several instrument techniques including Atomic Force Microscopy (AFM) and Scanning Electron Microscope (SEM) equipped with a new-generation energy dispersive X-ray detector (EDX).
![]()
![]()
In order to correlate the collected data and extract the relevant information, software with advanced processing capability was required. For this purpose, MountainsLab® developed by Digital Surf is particularly well adapted.
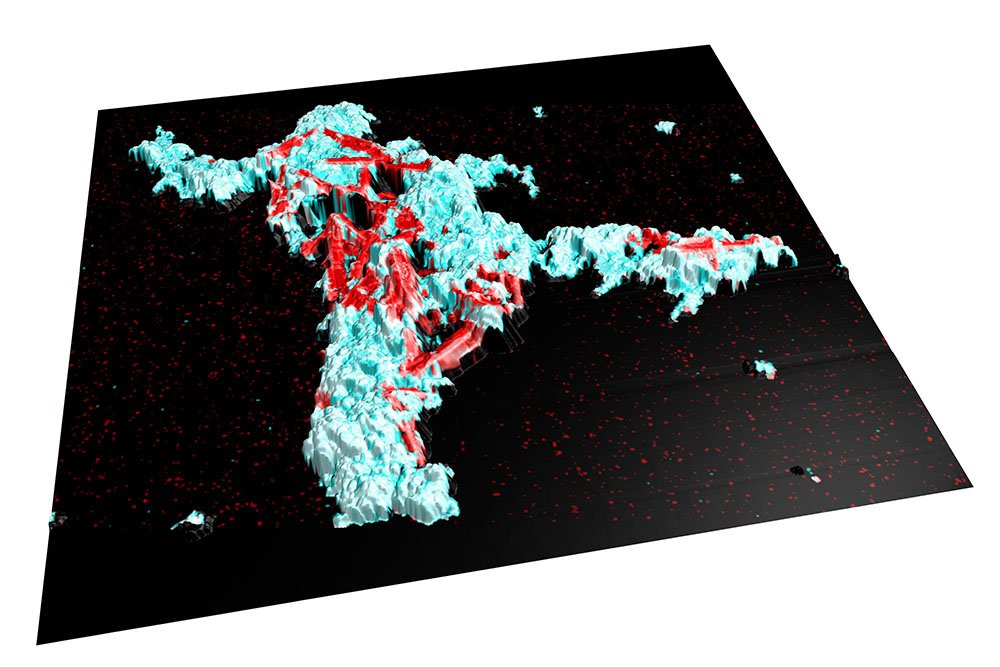
Above. 3D view of colocalized data (AFM topography + SEM image + EDX data).
Characterizing nanoparticles in mixtures
One of the problems regularly encountered in the measurement of nanoparticles are mixtures. Indeed, many products include several populations of nanoparticles to satisfy several needs. For example, to give an orange color to a product, the coloring agents TiO2 (white pigment) and Fe2O3 (red pigment) are mixed.
However, regulatory authorities require producers and suppliers to clearly determine the size and size distribution of each nanoparticle population. This step remains a challenge in the case of mixtures. The correlation of AFM/SEM/EDX measurements is thus a solution to this problem.
AFM and SEM data provide structural information on the particles. Indeed, AFM gives very precise information along the vertical axis, whereas the SEM provides a very high resolution in the plane. EDX is then used as a complementary tool to enable chemical identification and classification of each particle on the microscopy images.
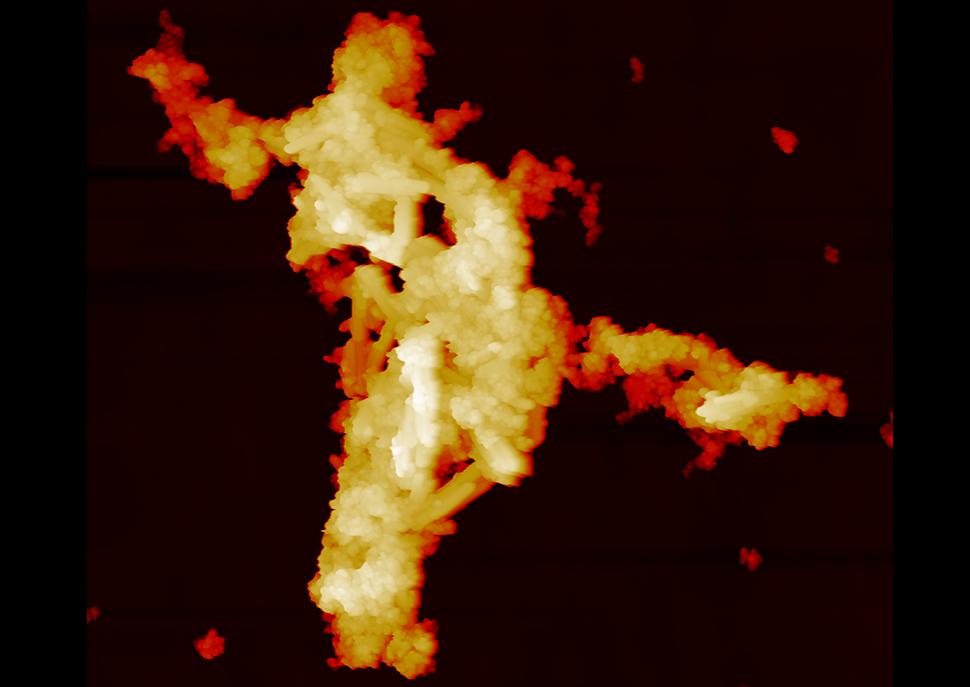
Above. AFM topography of a nanoparticle mixture
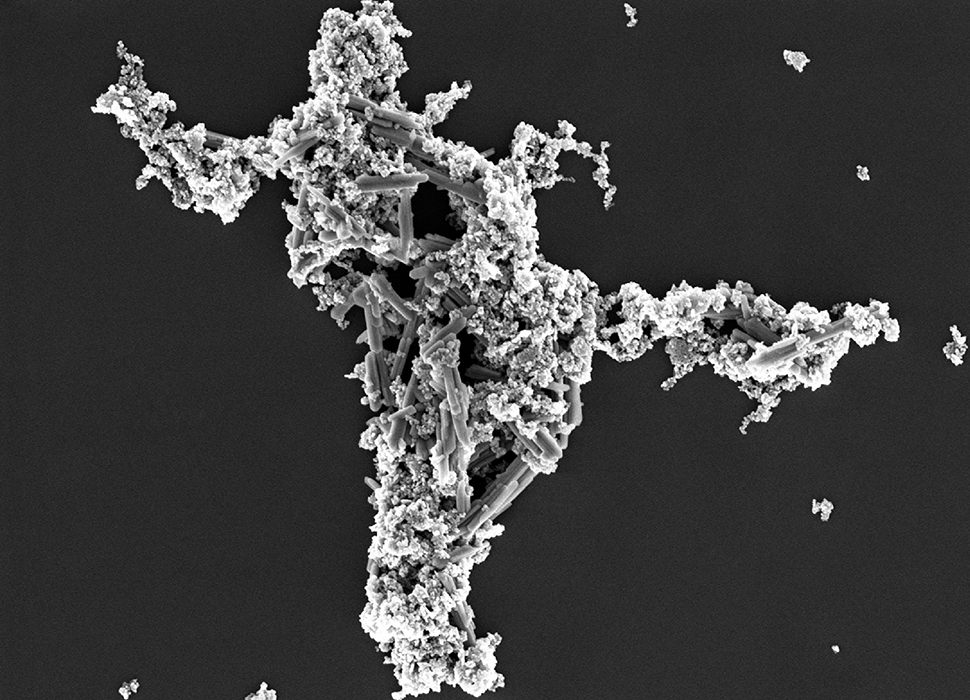
Above. SEM image of the same surface
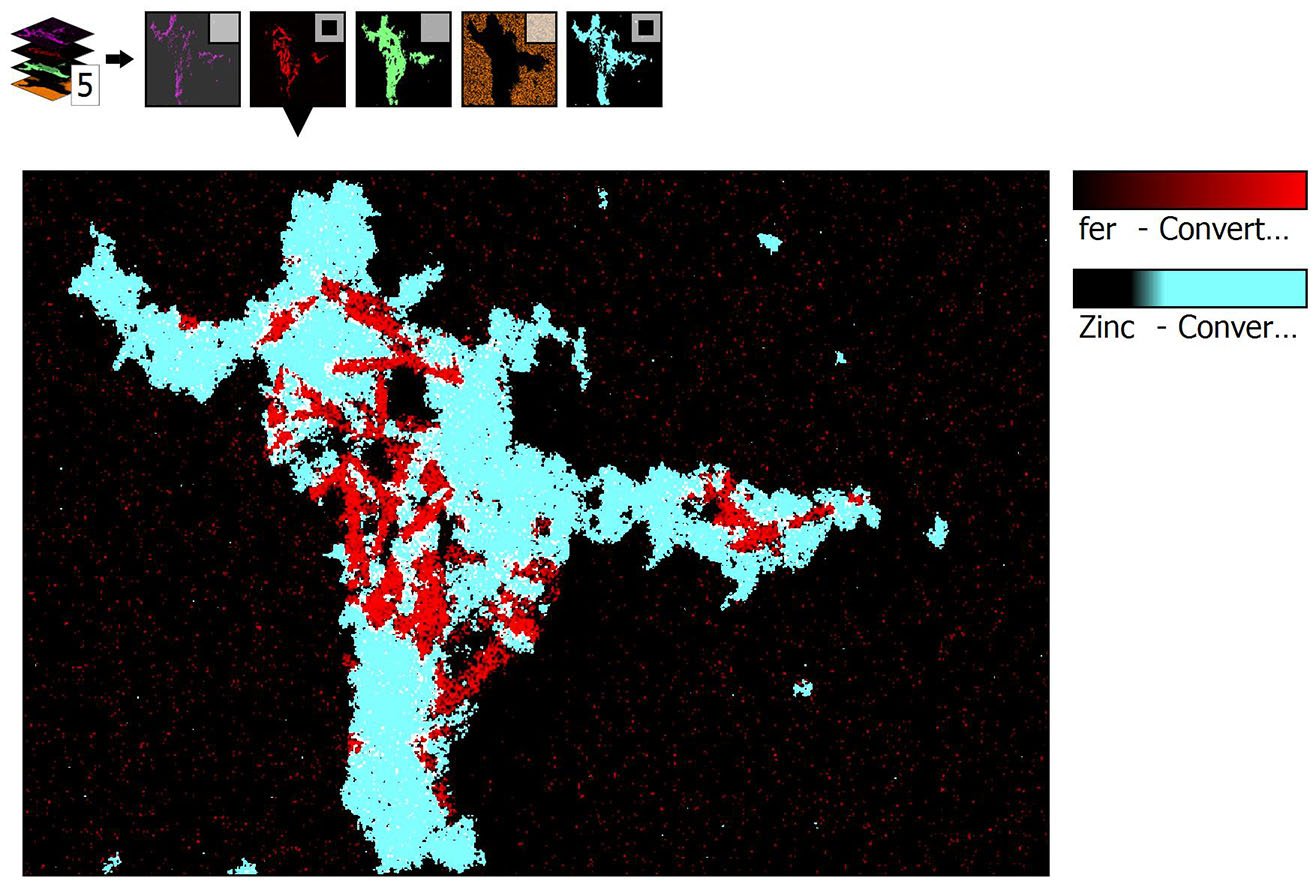
Above. EDX data. Areas high in zinc are shown in blue; areas high in iron are displayed in red.
Determining size distribution by correlation
In a recent study on a mixture of ZnO & Fe2O3, we demonstrated that the size distribution of each population is accessible by this combining technique. 3 steps are crucial to achieve the result:
- The sample is correctly prepared to avoid any agglomeration.
- The region of interest on the substrate is localized in order to image the same particles with different instruments.
- Correlation of the image data obtained is performed.
As each technique provides images associated with different information and reflecting its own limitations (calibration, dilatations, etc.), correlation can be very difficult to implement without post-processing. MountainsLab® software offers a large range of tools which allowed us to process the various datasets.
Firstly, each image was processed independently. For example, the AFM image was leveled. Then, thanks to the “Colocalization” tool, the AFM and SEM images were combined to obtain an image of the topography of the sample with high resolution in three dimensions. The resulting “image” is then further combined with EDX mapping (Fe and Zn).
Since the correlative image obtained gives us information in 3D, it is possible to obtain an estimation of the volume, size and size distribution of each nanoparticle population imaged.
Above. Particle analysis performed on correlated data showing areas, volumes etc.
ACharacterizing antimicrobial surface topography

It is well known that the current COVID-19 pandemic represents a serious problem for global health systems. Because of this, the control of surface-transmitted infections is highly desirable. A group of researchers from the University of Ferrara, Italy, defined a general procedure to characterize new materials obtained by anodic oxidation1. These types of surfaces, due to their nano-porous structure, act as reservoirs of silver ions which in turn confer antimicrobial properties to the surfaces. Anna Nastruzzi, one of the researchers involved in the study, explains more.

“We recently investigated different approaches for surface modification with the aim of reducing contamination, including the use of biological active metals” explains Anna Nastruzzi, Materials Science Engineer.
“This approach appears particularly interesting because the obtained material has an appropriate balance between the antimicrobial and mechanical properties, both of which are suitable for engineering applications.
In order to explore the potential of anodized aluminium alloys, our team investigated the tribological, anticorrosive and antimicrobial performances of a new material obtained by an innovative anodic oxidation, defined as Golden Hard Anodizing GHA.®” she says.
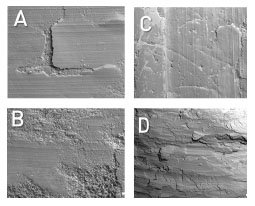
Figure 1. Representative SEM images relative to the pin-on-disk wear tests on GHA specimens. The images are relative to analyses showing different mechanisms of wearing such as: delamination (A), three body (B), abrasive (C) and tribo-oxidative (D).
Analysis of anodic oxide and GHA materials
The laboratory of the Metallurgic Group within the Department of Engineering and the Laboratory of Biomaterials and Encapsultion (BEL) within the Department of Chemical, Pharmaceutical and Agricultural Sciences, both at the University of Ferrara, performed a series of tribological determinations through 3D wear trace reconstruction (profilometric analysis). In addition, the morphology of the wear surfaces was studied by means of a scanning electron microscope (SEM) and EDS analyses.
“The different analyses that were carried out by our team were performed using a non-contact profilometer and processed with MountainsMap® software. We employed the following operators in our workflow: spatial filter, fill in non-measured points, form removal, 3D surface reconstruction of the analyzed area and extracted profile.
By using a non-contact profilometer, we were able to investigate the surface topography before the tribological tests and, at the end of the tribological tests, to scan and acquire each wear track”.
The surface topography was expressed by the parameters Rz, Ra, Rq, Rsk and Rku. “Rsk is particularly important as it gives information on the morphology of the surface texture” Nastruzzi explains. “Positive values correspond to high peaks spread on a regular surface (distribution skewed towards the bottom) while negative values are found on surfaces with pores and scratches”.
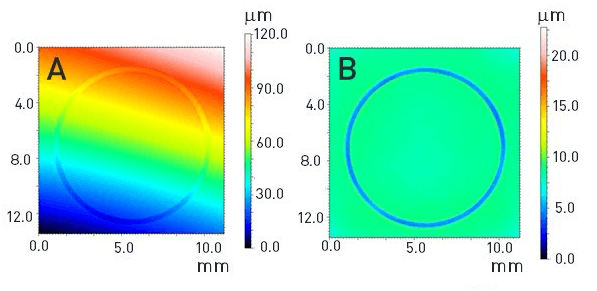
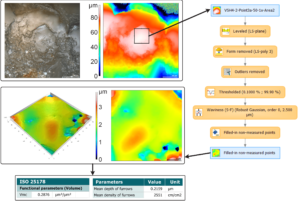
Figure 2. Three-dimensional wear trace reconstruction process performed by Mountains® software to calculate the area of the wear trace after pin-on-disk tests. (A) Raw Pseudo-colour image, (B) image after filtering (Filter Median Denoising 3×3) and form removal (Form removed: polynomial of order 4).
“With the help of Mountains® software, we were also able to calculate the wear volume, starting from the (2D) pseudo-colour view (see figure 2A, above) and by applying the filtering and form removal operators (see figure 2B, above). Finally, the volume was computed by multiplying the cross-sectional area by the wear distance”.
Conclusion
“We found GHA to be a material with intrinsic antimicrobial properties and elevated mechanical, tribological and anti-corrosive features. Its treatment with silver ions is of significant importance in reducing the risk of contamination and preventing epidemic outbreaks.
In this study, MountainsMap® software was successfully used to characterize the GHA in view of its final application. Notably, it allowed for the determination of the initial roughness and of the wear rate by calculating the wear track area”.
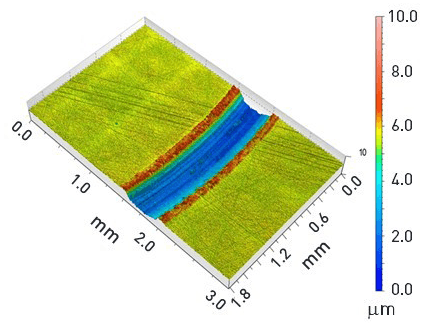
Figure 3. 3D view of the wear track.
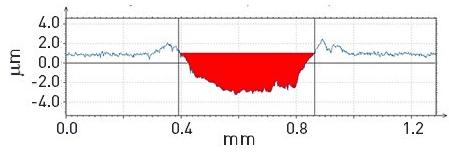
Figure 4. Extracted profile and cross sectional area evaluation.
1 An electrochemical method for the production of an oxide film on a metallic substrate.
About the authors
Anna Nastruzzi (Laboratory for Nuclear Materials), Franco Cicerchia (G.H.A. Europe s.r.l), Annalisa Fortini (Department of Engineering, University of Ferrara) and Claudio Nastruzzi (Department of Chemical, Pharmaceutical and Agricultural Sciences, University of Ferrara).
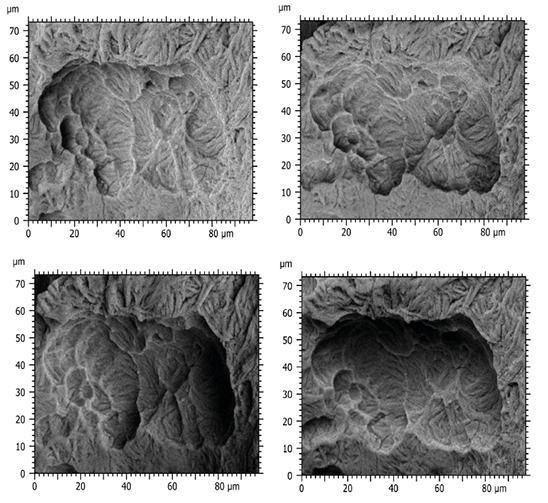
AQuantifying use-wear on quartzite stone tools

Past humans manufactured a variety of stone tools for diverse uses. These tools are found in abundance at archeological sites and often represent the only record of the presence and behaviors of these past humans.
Tool use leaves specific microscopic wear patterns on the tool surface. Traditionally, these patterns have been analyzed in 2D and qualitatively, but 3D quantitative analysis is seen as a way to improve the objectivity of the analysis. While many such quantitative analyses have been applied to stone tools made of flint, very few have focused on quartzite tools, even though many important archeological sites yield mostly quartzite artifacts.
3D surface analysis of quartzite flakes
For this study, Dr. Antonella Pedergnana, along with a research team from Germany, Spain and England, knapped quartzite flakes to look like archeological ones. An actualistic experiment was carried out in which different flakes were used to process different materials: bone, antler, wood, cane and hide, with some flakes left unused as a control.
The surfaces of these experimental tools were then scanned in 3D with an LSM800 confocal microscope (Carl Zeiss Microscopy GmbH). The resulting surfaces were processed using Zeiss’ ConfoMap software (based on MountainsMap®) to calculate a range of surface texture parameters from the ISO 25178 standard, and also to perform scale-sensitive fractal analysis, and motif, furrow and texture direction analyses.
Speeding up the analysis process with templates
Given the high volume of data that needed to be analyzed, each scan was processed in batch using different templates that were created within the software. These templates applied different operations and filters to each dataset in order to make the calculation of 3D surface texture parameters possible. The use of templates for this study sped up the process significantly.
Above. Template of a processing workflow from the acquired surface. Top left. Bright-field image of studied surface. Top right. Topography of the image. Bottom left. Topography of the surface in 3D. Bottom right. Topography of the surface in 2D. The values for Mean density of furrows, Mean depth of furrows, and Vmc are given for this surface.
Analyzing results
Beside improvements in repeatability and reproducibility, quantitative analysis makes it possible to apply machine-learning algorithms that can classify surface textures into classes of worked material using only the Mean density and Mean depth of furrows parameters, and Vmc.
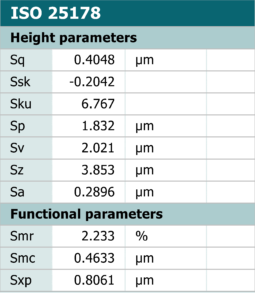
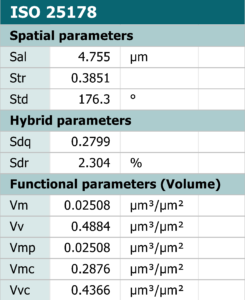
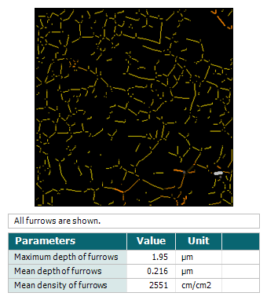
Above left. ISO 25178 parameters tables. Above right. Furrows analysis.
In doing so, it was shown that the wear due to some worked materials (hide and bone) is very specific and easily identifiable, while others (antler and wood) are mixed with each other; the remaining ones (cane, unused) cannot be classified with any certainty.
Conclusion
While several surfaces were analyzed per sample, this preliminary analysis was still applied to a small number of samples; adding more samples will surely improve the accuracy of the classification. This will in turn make the quantitative analysis even more reliable in deciphering how past humans used their tools, in order to better understand their behaviors.
Instrument & software used
Zeiss LSM800 confocal microscope + Zeiss’ ConfoMap based on MountainsMap®.
AInvestigating next-gen engine components at the nanoscale

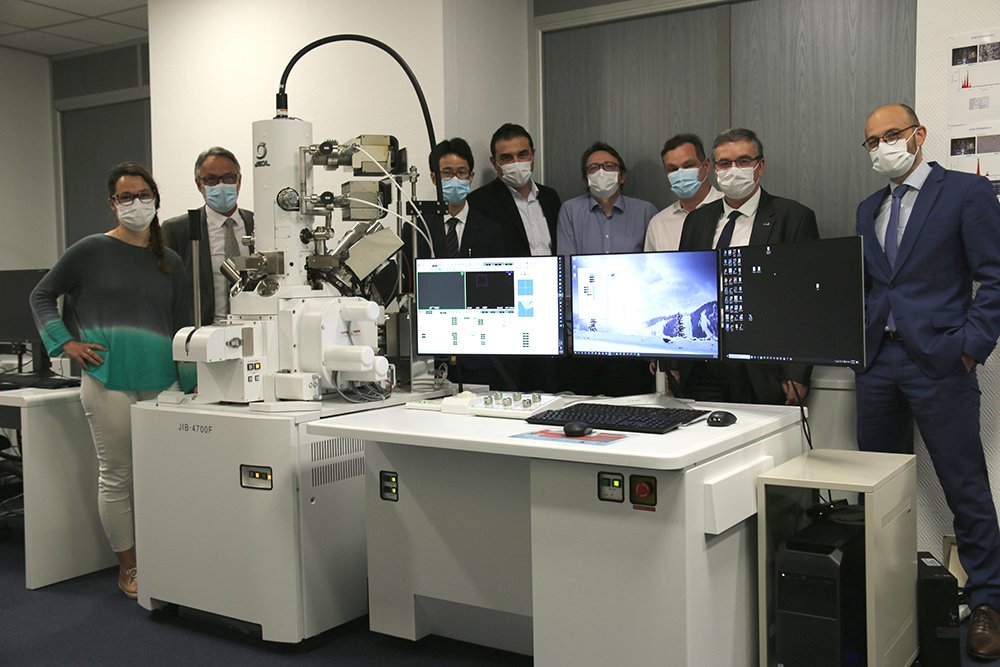
Currently, one of the major challenges in the automotive industry is the development of direct current (DC) electrical motors. A DC vehicle motor incorporates strong magnetic fields at the rotor location. The higher the magnetic field in a reduced volume, the better the engine efficiency factor. A research team based at JEOL France recently studied the composition of such a magnet using a FIB-SEM technique coupled with a specialized analysis software package.
Composition of a Cerium-alloyed Nd-Fe-B magnet
The key component of the engine is the permanent magnet located inside the rotor assembly which must have very high efficiency.
The sample studied was a Cerium-alloyed Nd-Fe-B magnet (Ce-NdFeB). The Cerium partly replaces the very expensive Neodymium rare-earth element (REE) without compromising the magnetic properties.
The research and development of this technology requires excellent knowledge of the chemical phase tomography of the magnet.
FIB-SEM machining & imagery in BSE mode
Mountains® 9 software tomography analysis is based on a series of high-resolution images representing successive cross sections taken through the depth of the sample. These different planes are produced by FIB machining and imaged in BSE mode.
BSE images are in shades of gray; the composition of the different gray levels of the image is proportional to the atomic mass of the chemical elements that make up the surface being analyzed.
The FIB/SEM technique was first highlighted by the semiconductor industry, seeking to understand the 3D complex structure and/or internal specific failure of electronic devices. JEOL (Japan Electron Optics Laboratory Company Tokyo, Japan), understood the need for Focused Ion Beam (FIB) systems early on and introduced the JIB-10 instrument in 1983.
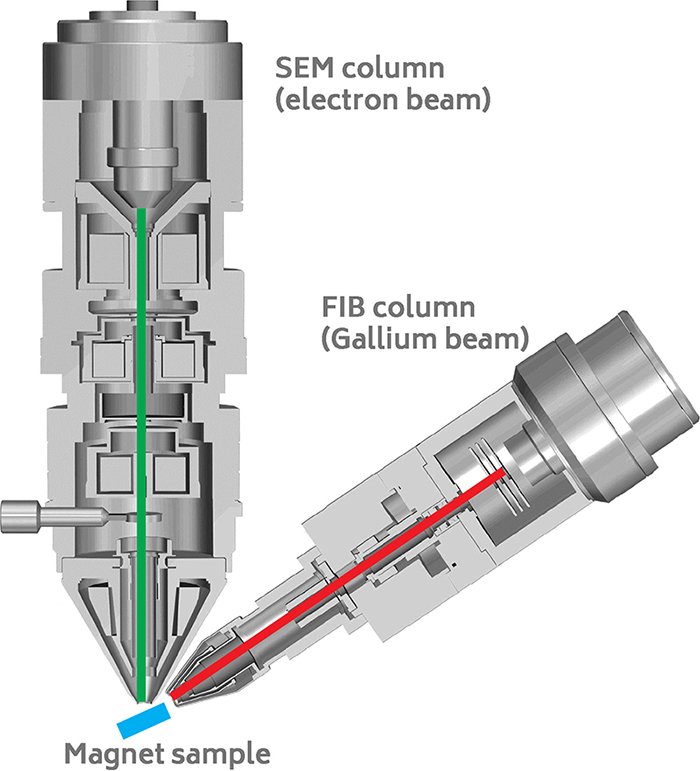
The experiment involved slicing and imaging the magnet with electrons under a strong magnetic field. This was particularly challenging since the magnetic field deflects the electrons.
The new JIB-4700F multiple-beam system from JEOL was able to overcome this difficulty. The magnet was sequentially milled using the ion beam (red arrow in Figure 1a) and imaged by the electron beam (green arrow).”
 (a)
(a) 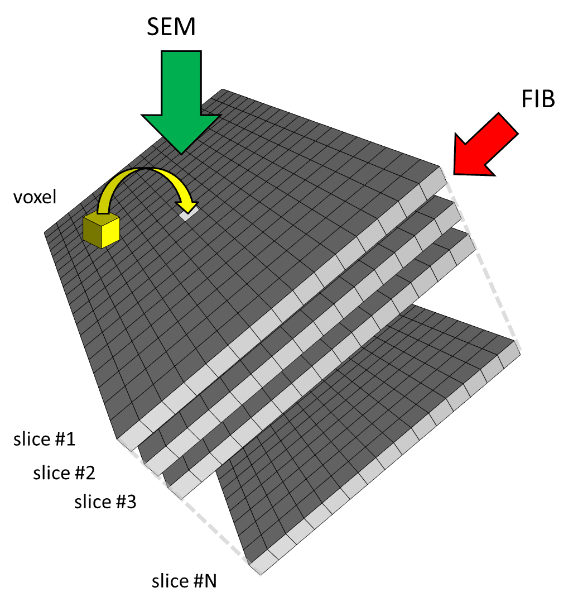 (b)
(b)
Figure 1. FIB machining & imaging in BSE mode.
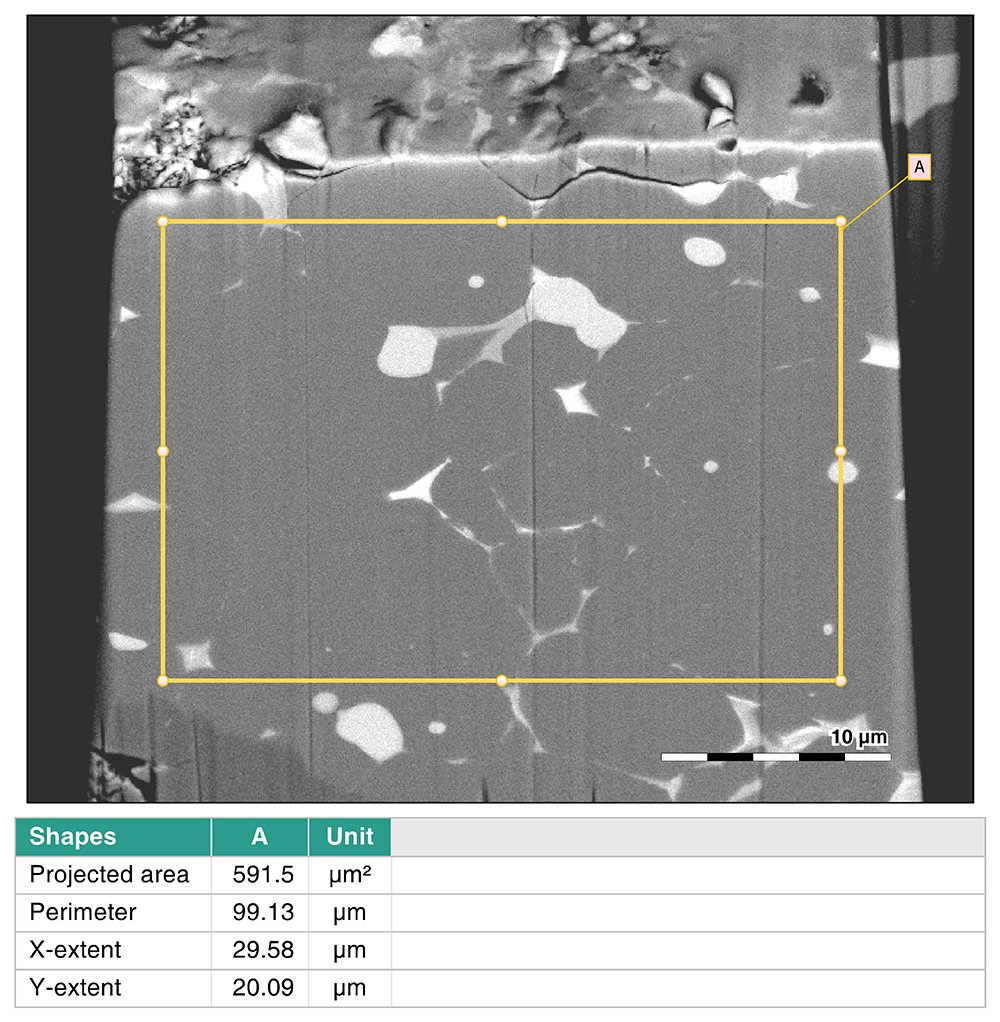
Figure 2. One of the series of BSE images with highlighted ROI.
Image processing
SMILEView™ Map software, powered by Mountains® allowed full 3D imaging and analysis of the chemical composition of the magnet material.
The chemical cube generated from the set of BSE images was segmented according to gray scale ranges corresponding to various chemical elements.
Numerous parameters including volume parameters were then calculated on the differentiated and segmented chemical elements (see Figure 3).
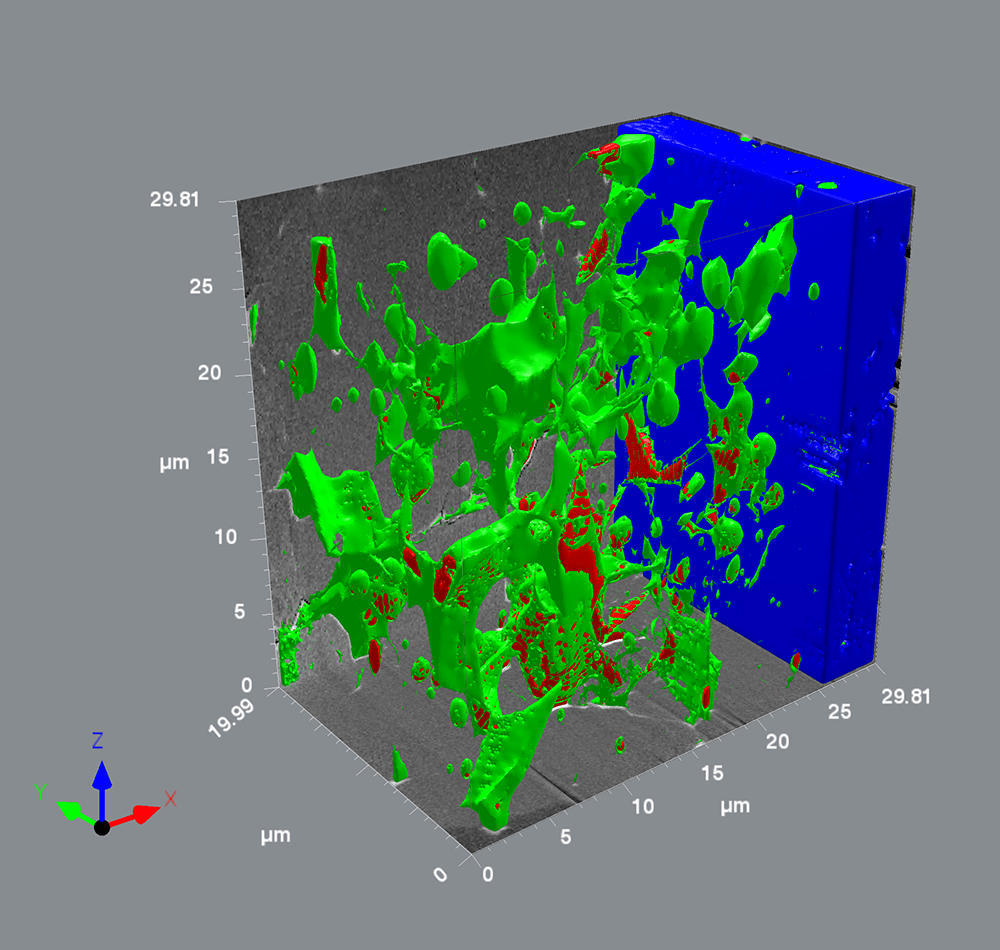
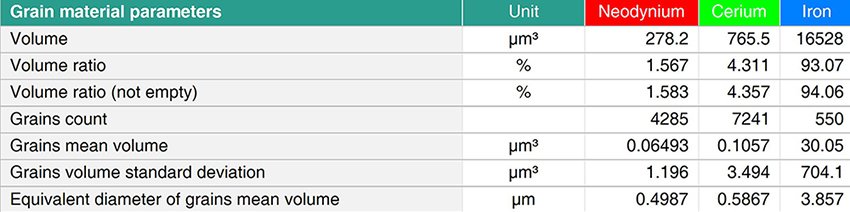
Figure 3. Visualization of BSE image stack as a cube (above) and volume parameters (right).
Once the tomogram is rebuilt, the user can virtually re-section the sample using the software, fully explore the 3D volume and get a full understanding of the magnet inner structure.
In this particular reconstruction we can observe very rich intergranular structure of Neodymium and Cerium with a low concentration of Iron in a Nd2Fe14B magnetic matrix.
Authors:
- Guillaume Lathus, Sales Director JEOL (Europe) SAS
- Franck Charles, General Manager JEOL (Europe) SAS
- Jean-Claude Menard, Senior Applications Specialist
- Special thanks to Damien Leroy (ILM)
Instruments & software used
JEOL JIB-4700F multiple-beam system + SMILEView™ Map software, powered by Mountains®
AIntra-oral scanners for tooth erosion quantification

Erosive tooth wear is a common oral condition that increases in severity with age. It is most commonly caused by acids in our food and drinks and involves the chemical and physical etching away of hard dental tissue. If left unmanaged, it can result in complete degradation of enamel and exposure of dentine, leaving teeth smaller with a dull yellow appearance and causing tooth sensitivity and pain. A research team at King’s College London has been working on ways to improve the understanding of the tooth wear process itself and investigating innovative techniques for clinicians to monitor and treat it.
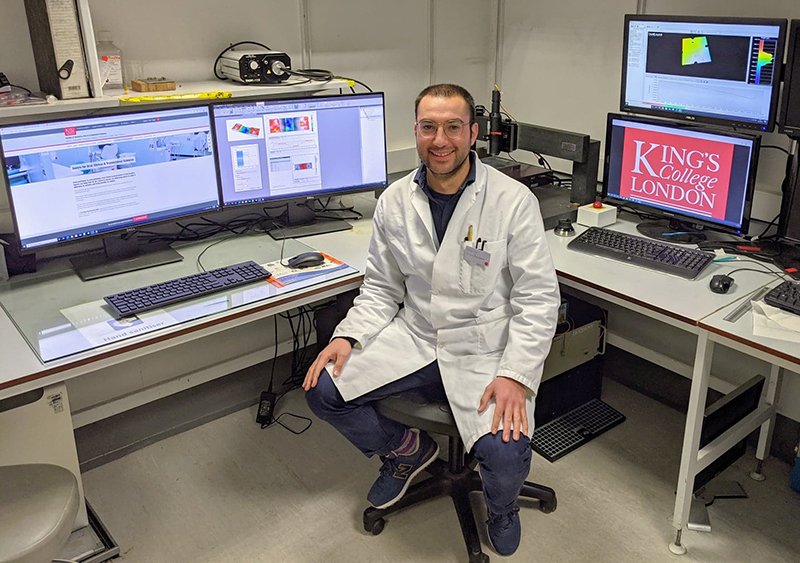
Above. Dr Polyvios Charalambous, member of the research team.
Assessing a new tool
“Currently, there is a pressing requirement for the development of quantitative in vivo methods to measure tooth wear directly on patients” explains Dr Polyvios Charalambous. “Conventional methods for clinically monitoring tooth wear such as tooth wear indices, dental casts and clinical photography all rely on subjective qualitative visual feedback. Advancements in 3D imaging and digital surface measurement have allowed quantitative methods to be developed which involve taking dental impressions of patients at different points in time, pouring them into dental stone to construct dental casts and scanning these with a 3D scanner to quantify surface changes using dedicated software. These workflows are complicated and cumbersome, consisting of multiple steps and requiring highly expensive equipment and skilled operators, limiting them to an academic setting.”
“Intra-oral scanners (IOS) are handheld clinical devices that can capture the 3D geometry of teeth inside a patient’s mouth with the aim of replacing the need for conventional dental impressions” Polyvios continues. “They are becoming more common in the clinical setting and whilst primarily designed for digital production of CAD/CAM restorations, can provide the required digital surface models. There is therefore a potential for in vivo quantification of surface changes on teeth and dental materials using surface metrology principles.”
“Investigating the performance of intra-oral scanners in quantifying tooth wear on naturally curved tooth surfaces is ideal as it is more clinically relevant and is the focus of our current and future research. Our first goal was to determine the intra-oral scanner’s limitations by using a controlled and standardized wear model, thus reducing measurement errors commonly seen in surface imaging algorithms. Flat, polished samples allow vertical enamel loss measurements in the form of step heights by comparing the flat reference datums on either side of the wear lesion and the lesion itself” he explains.
“Our research team aimed to determine the measurement limits of a commonly used intra-oral scanner, compared to a highly accurate 3D profilometer as the gold standard for measuring wear changes on polished human enamel (depths of 21.8–269.0μm) as well as changes on surfaces with increasing roughness.” To the authors’ knowledge, this is the first study in which datasets from intra-oral scanners were analyzed with Mountains® software.
“Our study reports new findings combining optimized imaging workflows with intra-oral scanning which revealed for the first time that intra-oral scanning can only detect Sq surface roughness of silicon carbide particle sizes above 68.0μm. This highlights limitations in measuring short-wavelength surface features compared to profilometry. In terms of step height detection, an automated lesion localization algorithm revealed the measurement threshold of the intra-oral scanner to be 44.02μm, showing for the first time that enamel lesions can be reliably quantified using automated detection at the sub-50μm level. This is comparable to the level of annual wear of human enamel, estimated to be around 38μm (Lambrechts et al. 1989). This finding shows promise for intra-oral scanners as diagnostic and research tools for quantifying tooth or material wear; however, further technological advancements are still required.”
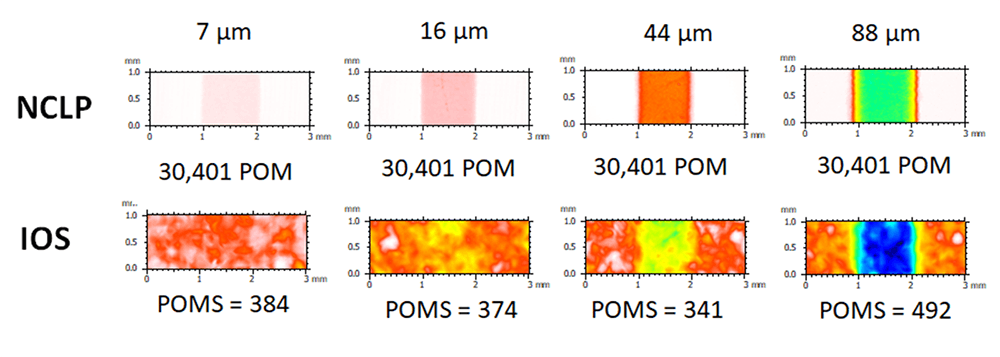
Above. Measurements (µm) of lesion depth using a non-contact laser profilometer (NCLP) and an Intra-oral scanner (IOS).
Automating analysis
“The unique functionalities of Mountains® software helped us develop an automated lesion detection and analysis workflow. To investigate the measurement limitations of IOS, measurements of Sq roughness, 3D surface step heights (ISO 5436-1) and XY wear lesion areas were compared with those of the non-contact laser profilometer (NCLP), corroborated by Gaussian skewness (Ssk) and kurtosis (Sku) analysis.
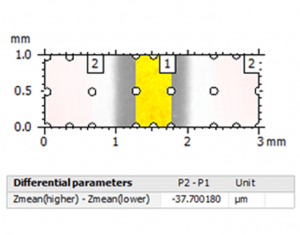
Firstly, the 3D step height (in μm) of the central lesion was calculated using a predefined selection of the polished enamel reference areas compared to the lesion, based on ISO 5436-1. Using Mountains®, these predefined areas were programmed to automatically have the same size and location on each NCLP and IOS digital surface.”
Example of an IOS digital surface:
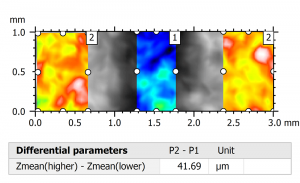
Above left. Pseudo-color view of the automated lesion surface using an intraoral scanner. Above right. Step height analysis on the pre-defined surface.
Example of an NCLP digital surface:
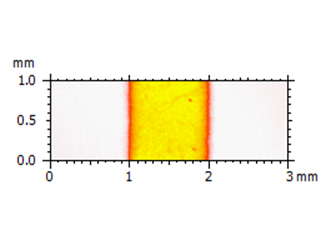
Above left. Pseudo-color view of the same surface using a non-contact laser profilometer (NCLP). Above right. Step height analysis of the surface.
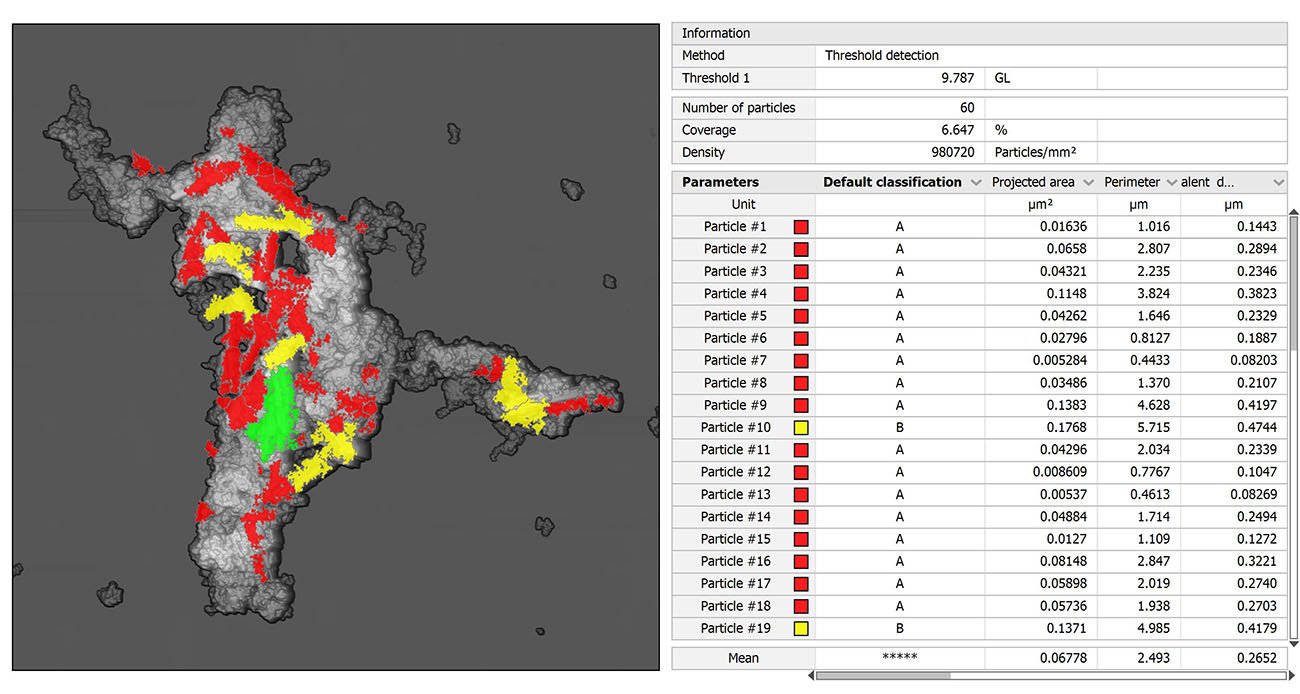
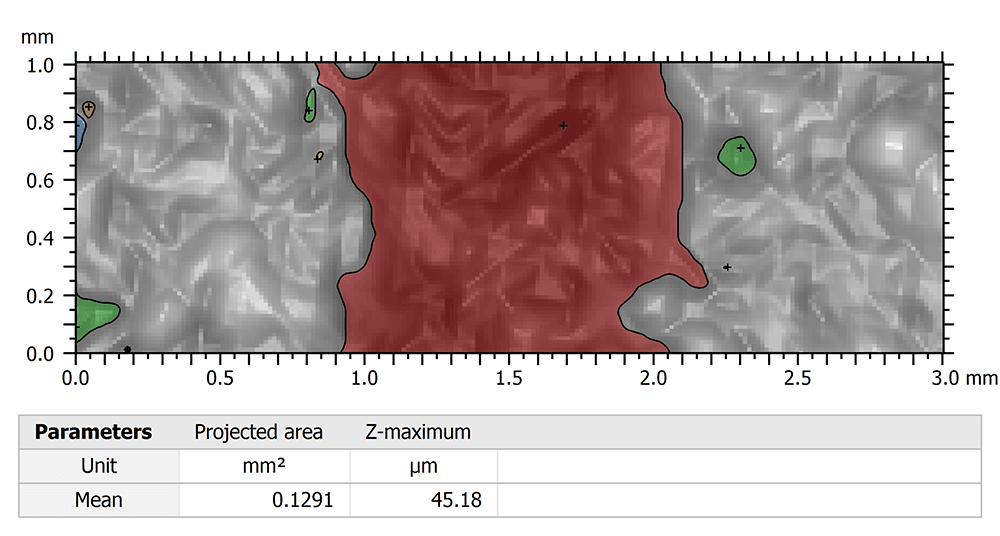
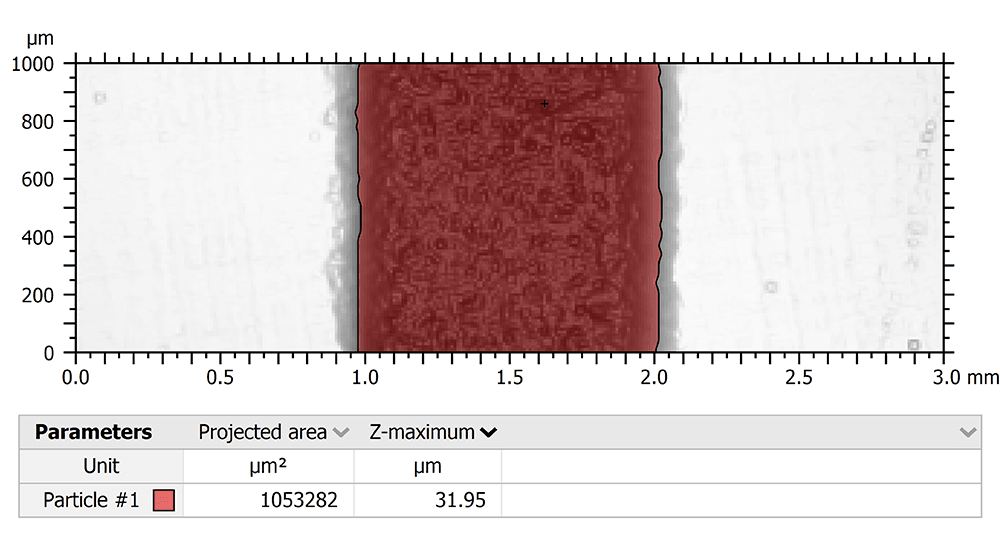
“Secondly, an automated lesion localization algorithm was used to determine the measurement threshold of the IOS by localizing and measuring the XY lesion area (in mm2) on each scan. We used the Particle analysis feature of the software, which detected surface points of measurement (POM) with Z-amplitudes below the mean plane of the surface heights according to the histogram of the surface heights distribution, on each 3×1mm dataset. The Z-heights of surface points inside a given lesion would be below the mean plane of surface heights in an otherwise planar surface, resulting in lesion localization. The surface area (in mm2) of these points was calculated for each IOS scan and compared to the NCLP.”
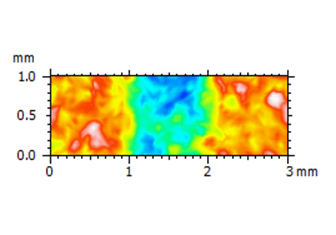
Above. Particle analysis of lesion using an IOS scan.
Above. Particle analysis of lesion using an NCLP scan.
“Finally, the Gaussian surface height distribution was analyzed on each 3×1mm dataset using surface skewness (Ssk) and kurtosis (Sku) parameters. The surface distribution curve of a nominally flat surface superimposed with a random roughness has a Gaussian distribution symmetrical about the height of the nominal plane which is quantified by Ssk equal to zero and Sku equal to three. In contrast a surface with a central lesion will display negative skewness and kurtosis less than three.”
Instruments & software used
True Definition intra-oral scanner by Midmark, TaiCaan Technologies XYRIS 2000 CL profilometer + MountainsMap® software (Step height study & particle analysis).